15 sheets so far
United States
An American Viticultural Area is a boundary written out in words: follow this road, then that creek, then the 500-foot contour. These sheets draw the words.
Napa Valley
- 1
- 2Oakville
Seventeen legal steps that start and end at the corner of Silverado Trail and Skellenger Lane.
27.4 km² · 18.9 °C Apr–Oct
- 3Rutherford
Shares a starting corner, a committee and a birthday with Oakville.
30.4 km² · 18.8 °C Apr–Oct
- 4Stags Leap District
The smallest American sheet so far, small enough to fit inside one square of the climate grid.
12.3 km² · 18.9 °C Apr–Oct
- 5Howell Mountain
Defined by a single contour line: the ground above 1,400 feet.
52.8 km² · 17.6 °C Apr–Oct
- 6Los Carneros
One appellation in two counties, starting on the county line itself.
151 km² · 18.6 °C Apr–Oct
Sonoma County
- 1Sonoma Valley
Surveyed peak to peak: Wildcat Mountain, Sonoma Mountain, Taylor Mountain, Buzzard Peak.
465 km² · 17.9 °C Apr–Oct
- 2Sonoma Coast
Starts where the Mendocino county line meets the Pacific. A good part of it is nowhere near the beach.
2,090 km² · 16.6 °C Apr–Oct
- 3Russian River Valley
Begins on the Healdsburg Avenue bridge and follows the river downstream.
691 km² · 17.3 °C Apr–Oct
- 4
- 5Alexander Valley
Drawn along the section lines of the township survey, and redrawn five times.
316 km² · 18.3 °C Apr–Oct
Willamette Valley
- 1Willamette Valley
Nearly nine times the size of the Napa Valley AVA, fenced by the 1,000-foot contour.
13,959 km² · 14.8 °C Apr–Oct
- 2
- 3Eola-Amity Hills
Starts at a highway junction beside a golf course and climbs to the 200-foot contour.
158 km² · 14.8 °C Apr–Oct
- 4Chehalem Mountains
The coolest sheet in the atlas so far, spread over three counties.
252 km² · 14.5 °C Apr–Oct
Going there
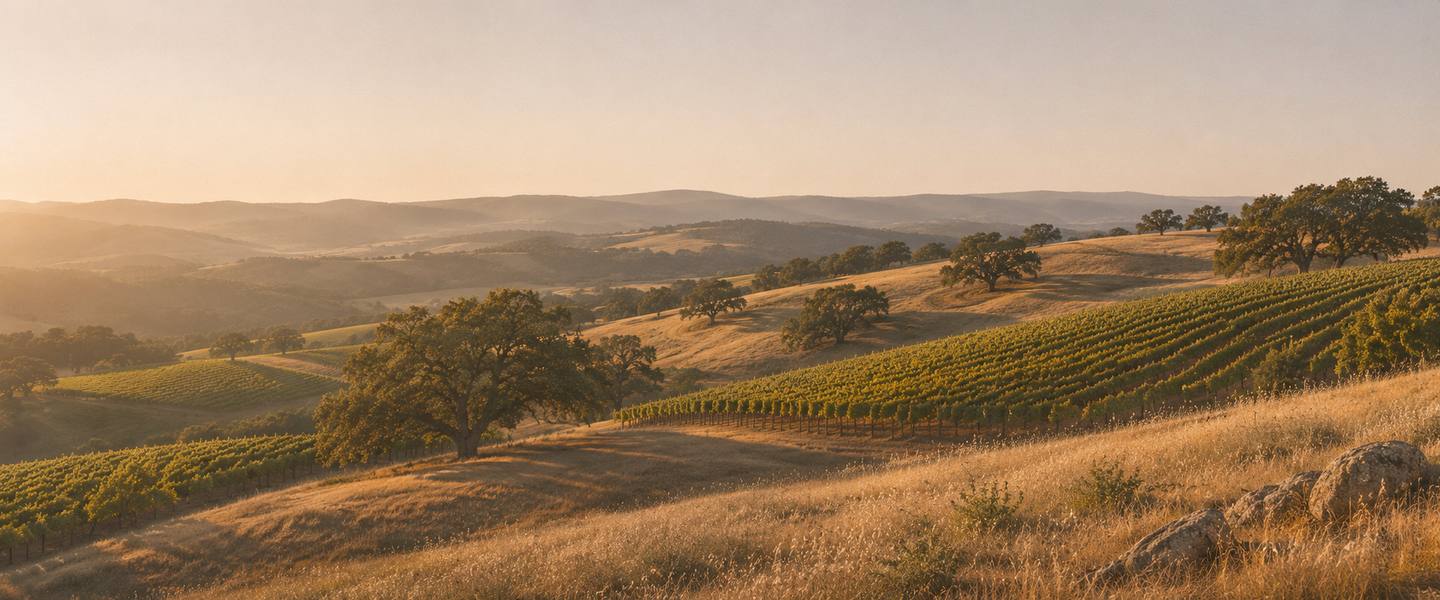
When each region is warm and when it is dry, read off the same figures as the sheets. The photographs show kinds of day. None of them is a place in this atlas.



Napa Valley
Warmest in July, about 22 °C (71 °F). Driest in June, July, and August; wettest in January, with about 171 mm.
Browse Napa Valley wine toursSonoma County
Warmest in August, about 20 °C (68 °F). Driest in June, July, and August; wettest in January, with about 209 mm.
Browse Sonoma wine toursWillamette Valley
Warmest in August, about 19 °C (66 °F). Driest in June, July, and August; wettest in December, with about 219 mm.
Browse Willamette Valley wine tours
Bars are rain, hanging from the rule as they do on each sheet’s year, all to one scale. The underlined month is the warmest. Each row is a plain average of that region’s sheets so far, from WorldClim 2.1 monthly normals (CC BY-SA 4.0).
The “find” and “browse” links above go to shops and booking sites. If you buy something there we may be paid a commission. You pay the same either way. How we’re paid.