10 sheets so far
France
France delimits its appellations field by field. These sheets show the parcels INAO has drawn, which is why a French appellation looks like scattered pieces where an American one is a single outline.
Bordeaux
- 1
- 2Pauillac
Identical to its neighbours on a climate grid, which says something about climate grids.
16.3 km² · 16.6 °C Apr–Oct
- 3
- 4
- 5
- 6Saint-Emilion
Nine communes, and a second appellation drawn over the same ones.
71.0 km² · 16.8 °C Apr–Oct
- 7
Burgundy
- 1
- 2
- 3
Going there
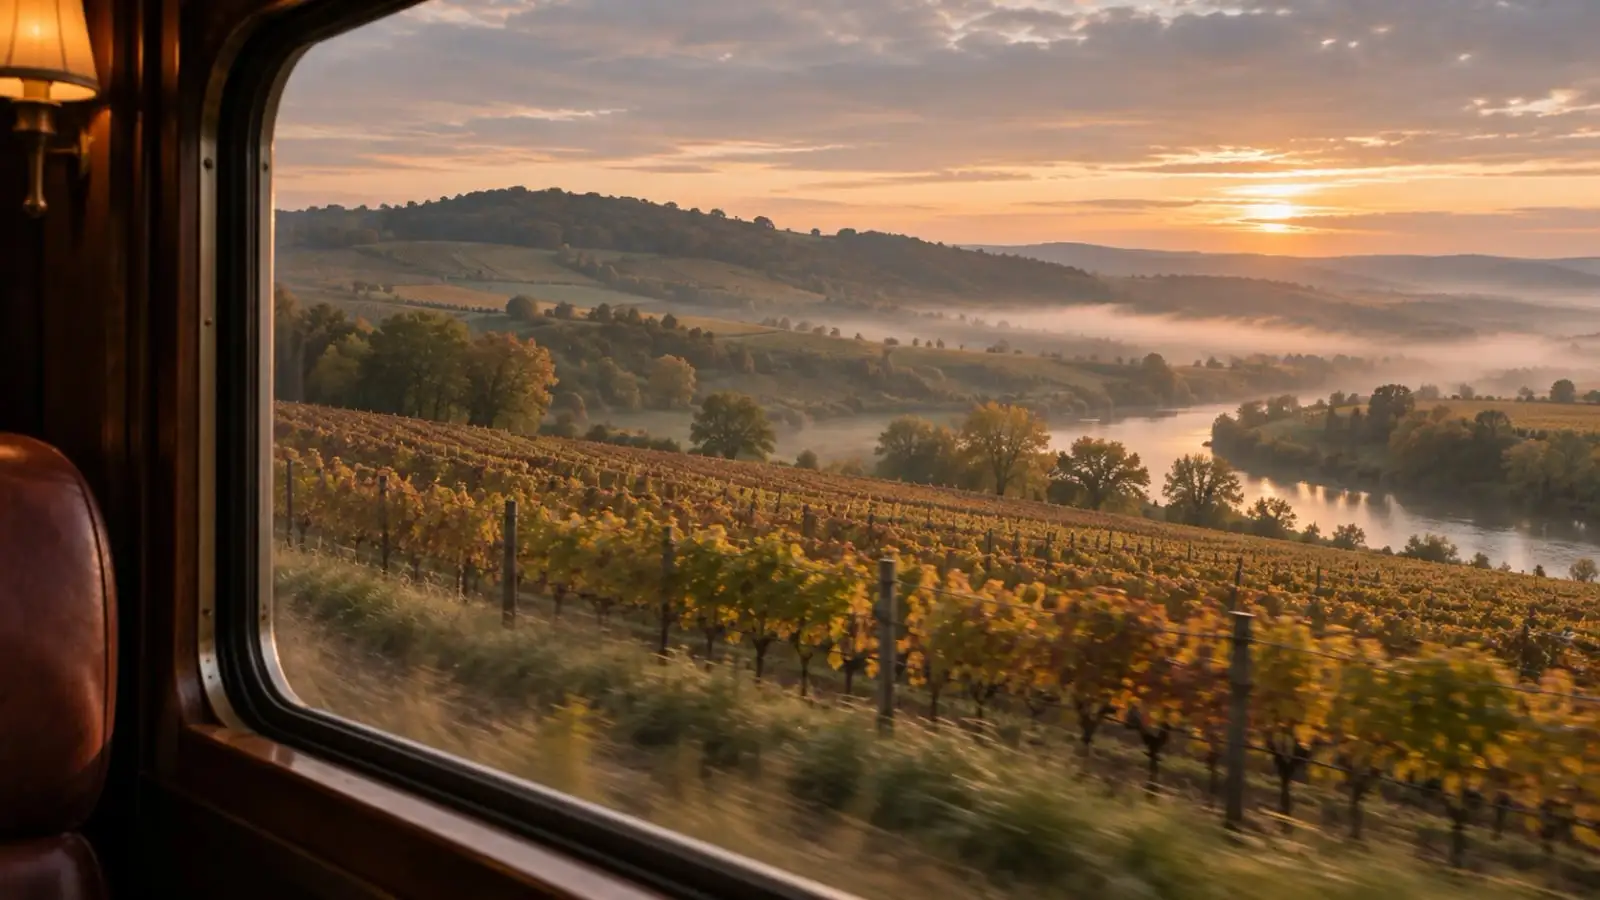
When each region is warm and when it is dry, read off the same figures as the sheets. The photographs show kinds of day. None of them is a place in this atlas.
Bordeaux
Warmest in July, about 20 °C (69 °F). Driest in June, July, and August; wettest in November, with about 102 mm.
Browse Bordeaux wine toursBurgundy
Warmest in July, about 19 °C (67 °F). Driest in February, March, and April; wettest in May, with about 82 mm.
Browse Burgundy wine tours
Bars are rain, hanging from the rule as they do on each sheet’s year, all to one scale. The underlined month is the warmest. Each row is a plain average of that region’s sheets so far, from WorldClim 2.1 monthly normals (CC BY-SA 4.0).
The “find” and “browse” links above go to shops and booking sites. If you buy something there we may be paid a commission. You pay the same either way. How we’re paid.